I created a little MarkLogic REST extension that has helped me get a good, first impression from XML data sets quickly, and helps create an initial set of indexes in MarkLogic as well. It is available free of charge: https://gist.github.com/grtjn/1aba4eb364de9268fb5f.
Intro
I also felt that creating indexes in MarkLogic was rather cumbersome. We use Roxy (http://github.com/marklogic/roxy) a lot within Vanguard. No surprise the two founders of that project are the lead-members of Vanguard. It provides a convenient way to provide index configuration (and many other MarkLogic settings) in XML, and push those with a single command. But you still have to write the index definitions yourself, often with a lot of repeated, and unknown namespaces, and such. I’d rather have a little tool to help me with that.
Why a REST extension? We tend to use JavaScript on top of the MarkLogic REST-api. I therefor packaged the tool as a MarkLogic REST extension. I also deliberately kept it single-file, to make it an easy and lightweight drop-in.
Deploying the tool
There are various ways to download and deploy the REST extension. To get you going:
- Download the REST extension from
https://gist.githubusercontent.com/grtjn/1aba4eb364de9268fb5f/raw/e60672edc6f9f64e3a53cbc0e97a580f58aa09a7/analyze-data.xqy
- Or use Curl:
curl -o analyze-data.xqy https://gist.githubusercontent.com/grtjn/1aba4eb364de9268fb5f/raw/e60672edc6f9f64e3a53cbc0e97a580f58aa09a7/analyze-data.xqy
After that you:
- Copy the downloaded file into the Roxy folder for REST extensions, and deploy it:
cp analyze-data.xqy rest-api/ext/
ml local deploy modules
- Or use Curl (replace myuser, mypass, and 8123 with appropriate values):
curl --anyauth --user myuser:mypass -X PUT -i -H "Content-type: application/xquery" -d@"./analyze-data.xqy" http://localhost:8123/v1/config/resources/analyze-data'
Running the tool
The tool does various counts. The first part does counts over the entire database, which can take a while, depending on the size of your database. The latter part takes a random set of (by default) 20 files, and performs analysis on those. The final part allows creation of indexes.
When you open the tool (have a minute patience, it will be doing all sorts of counts for you!) you will see something like this:

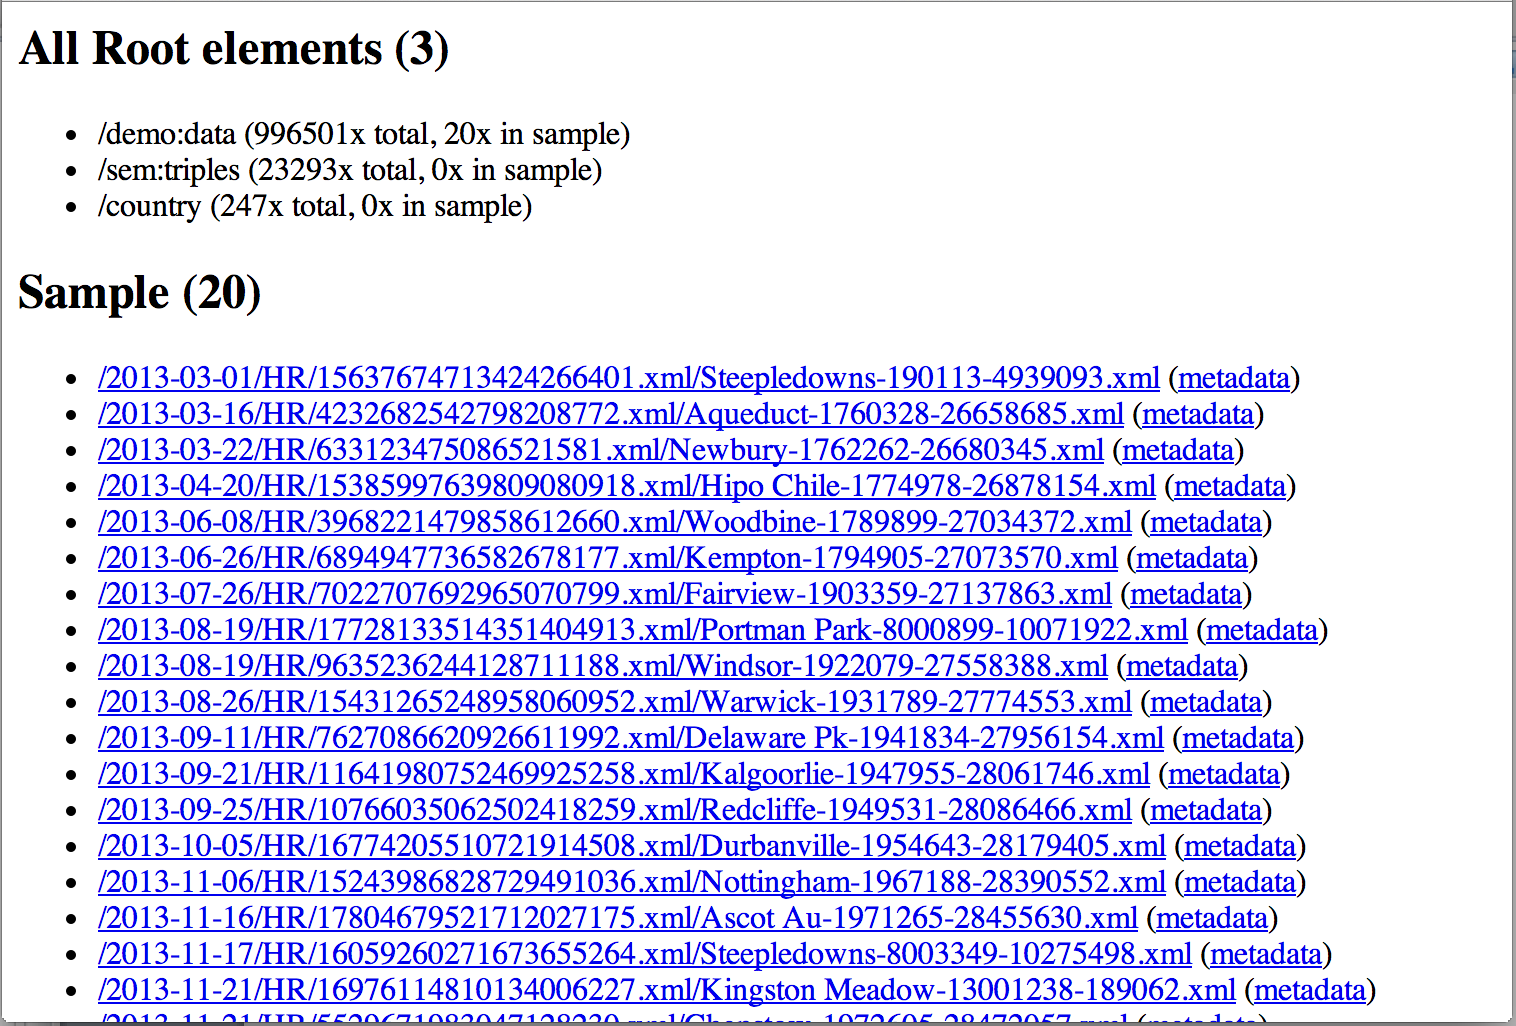
It immediately reveals various details. It gives counts of total number of documents, and counts for each of the main document types supported by MarkLogic: XML, Text, and Binary. It also provides a full list of discovered collections (requires collection-lexicon to be enabled), as well as top-1000 directories (requires uri-lexicon to be enabled), giving doc counts for every entry it lists. The last global count that is done is by root element, see next image.
Sample analysis
Based on the randomly chosen sample set, it provides insight into namespaces known to the system, and occurring within the sample set, a list of unique element paths, and a list of unique paths to any element or attribute containing character data (‘value’ paths). Each path is accompanied with an averaged count.
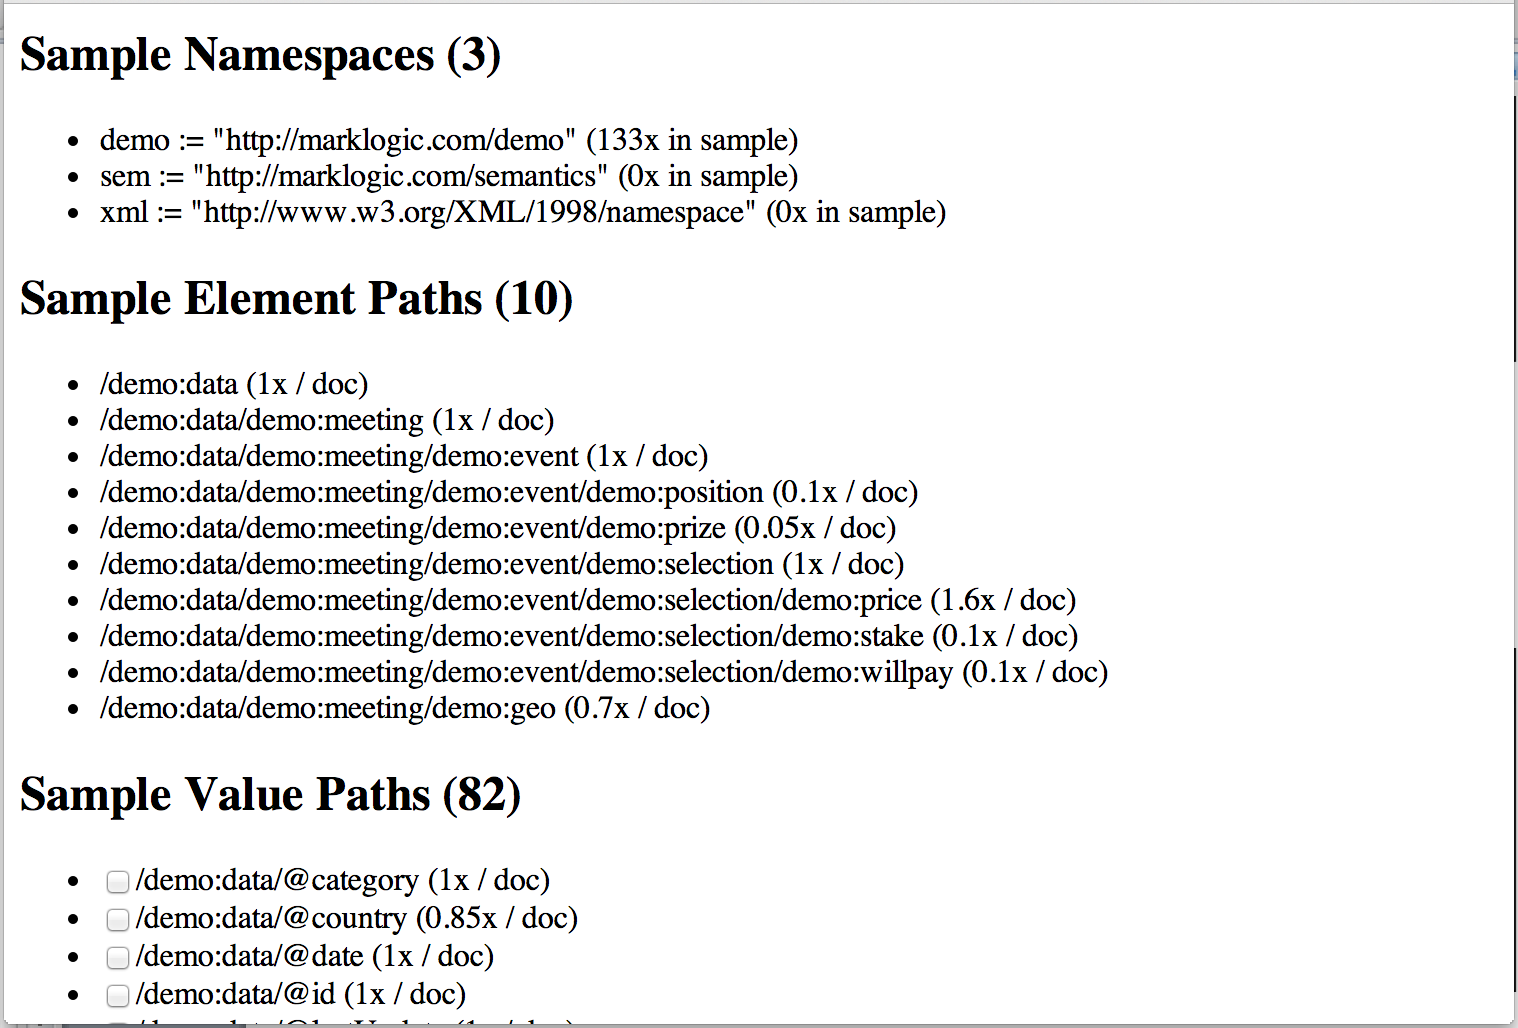
Element path counts can be useful to look for container elements that qualify for. High numbers high in the tree are usually an indication for that.
Value path counts can be useful to investigate data completeness. If for instance a certain attribute occurs much less often on an element than other attributes, then either it is an attribute to mark special cases (useful to know!), or it is an indication that your data source is providing incomplete data. The latter typically occurs when you are receiving data from multiple (independent) sources.
Note: empty elements and attributes are excluded from value paths at the moment.
Indexes
The last part is most interesting though. Based on the value paths from the sample set, it evaluates each path across the sample set, takes first 50 values of each, and displays the top-3 values of each. It also guesses the data-type of each, based on the top-1 value.
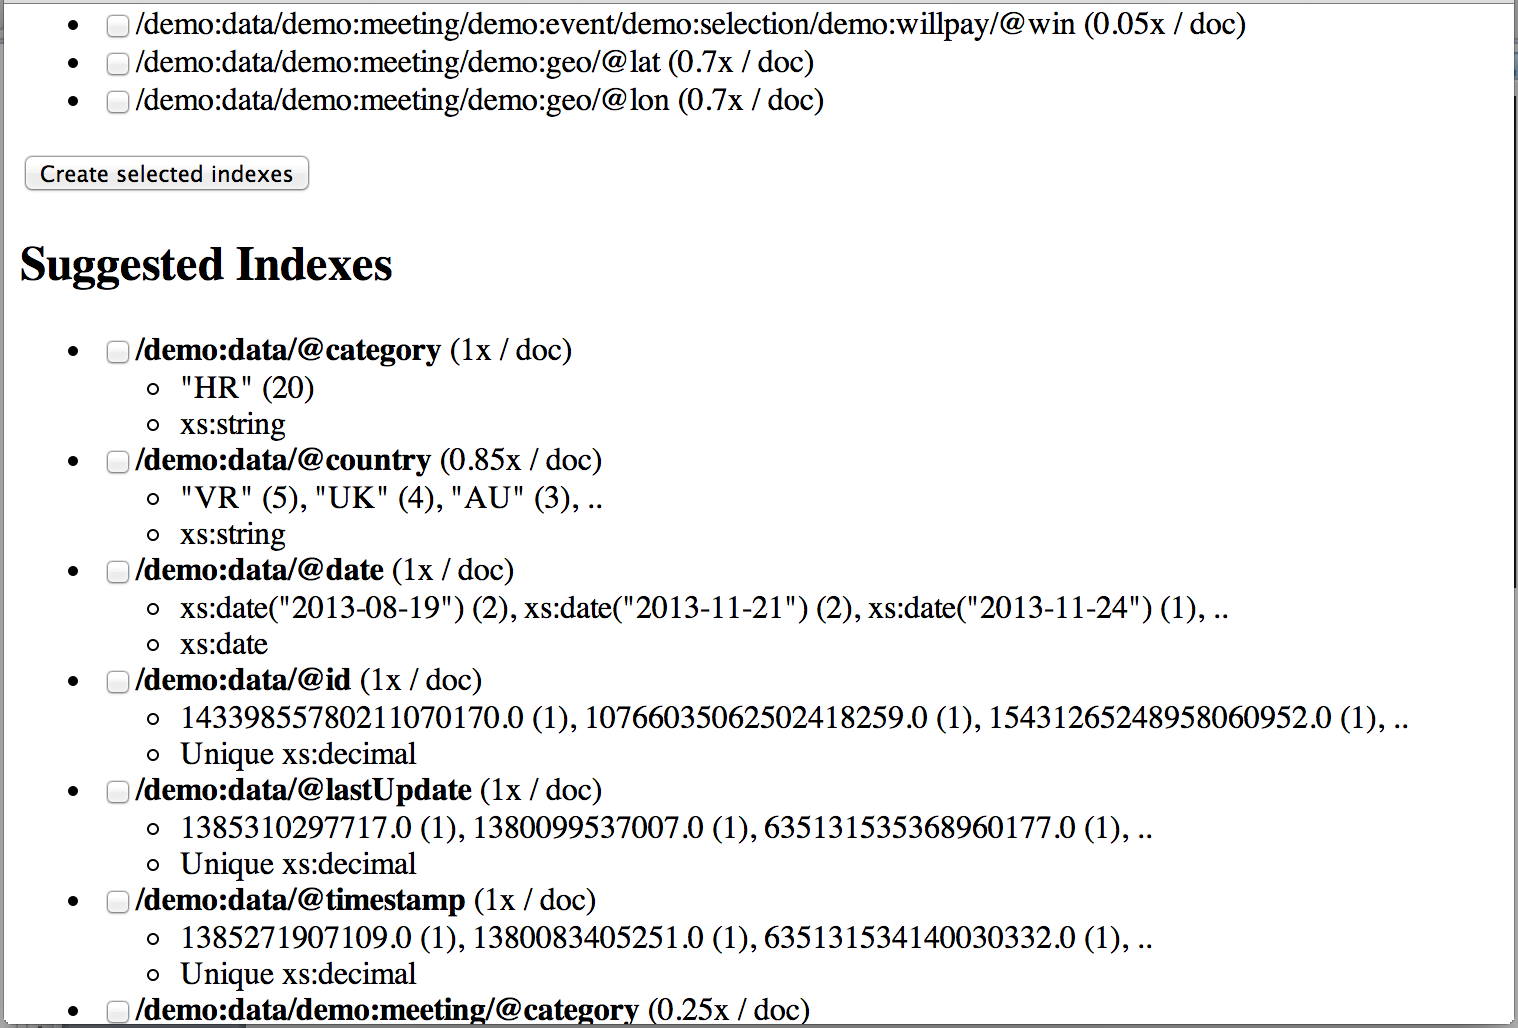
There is a checkbox displayed next to each value path (also applies to the Sample value paths section!). Simply mark the paths that appear worth indexing to you, and scroll down to the Create selected indexes button. This will create element and attribute range indexes for you. There code also contains functionality to create path indexes for you, but the MarkLogic App-Builder currently doesn’t support those, so I made the other ones the default.
All the way down a list of existing indexes are shown. There are checkboxes next to these as well, to allow removing them.
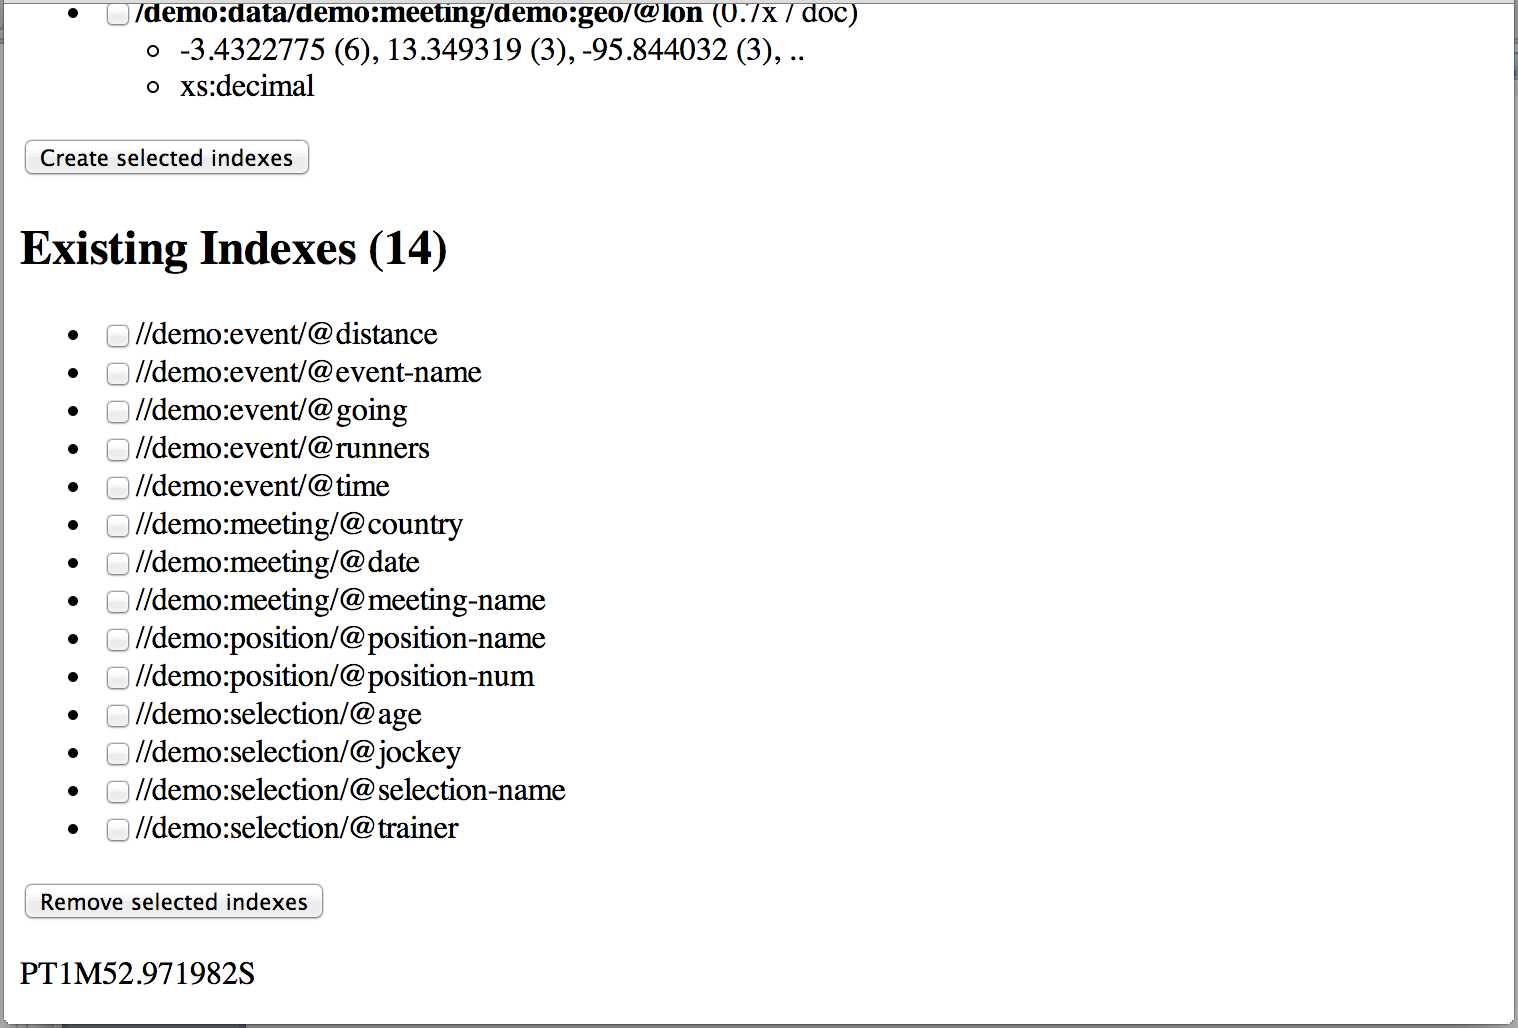
The last line of the page displays the ‘elapsed-time’ printed as xs:dayTimeDuration.
No comments:
New comments are not allowed.